---
title: Economist Corner
description: Explore the latest U.S. employment trends, including job growth, federal workforce cuts, and the impact of tariffs on the labor market.
---
[](http://www.geographicsolutions.com)
- Company
- [About Us](https://www.geographicsolutions.com/Company/About-Us)
- [Clients](https://www.geographicsolutions.com/company/clients)
- [Partnerships](https://www.geographicsolutions.com/company/partnerships)
- [Accolades & Achievements](https://www.geographicsolutions.com/company/Accolades-Achievements)
- [GSI International](https://www.geographicsolutions.com/Company/GSI-International)
- Solutions
- Industry
- [Workforce Development](http://geographicsolutions.com/Workforce)
- [Unemployment Insurance](http://geographicsolutions.com/Unemployment)
- [Economic Development](http://geographicsolutions.com/Economic)
- [Human Services](http://geographicsolutions.com/HumanServices)
- [Education](http://geographicsolutions.com/Education)
- [Corrections](http://geographicsolutions.com/Corrections)
- [Data Products & Services](https://www.geographicsolutions.com/Data-Products)
- Software
- [BIS | Benefits of an Integrated System](https://www.geographicsolutions.com/Integrated)
- [VOS | Virtual OneStop](http://geographicsolutions.com/VOS)
- [VCON | VOS Connect](https://www.geographicsolutions.com/VCON)
- [GUS | Geographic Solutions Unemployment System](http://geographicsolutions.com/GUS)
- [REX | Reemployment Exchange](http://geographicsolutions.com/REX)
- [VLMI | Virtual Labor Market Information](http://geographicsolutions.com/VLMI)
- [ALMA | America’s Labor Market Analyzer](http://geographicsolutions.com/ALMA)
- [VCC | Virtual Career Center](http://geographicsolutions.com/VCC)
- [VOS REO | Reentry Employment Opportunities](https://www.geographicsolutions.com/VOSREO)
- [NTET | No-Touch Employment Tools](https://www.geographicsolutions.com/COVID)
- [SMP | Specialty Micro Portals](https://www.geographicsolutions.com/SJA)
- [BEN | Benefit Exchange Network](https://www.geographicsolutions.com/BEN)
- Federal Programs
- [Workforce Innovation and Opportunity Act](http://geographicsolutions.com/WIOA)
- [Wagner-Peyser](http://geographicsolutions.com/WagnerPeyser)
- [Adult Education](http://geographicsolutions.com/AdultEd)
- [Vocational Rehabilitation](http://geographicsolutions.com/VocRehab)
- [Supplemental Nutrition Assistance Program](http://geographicsolutions.com/SNAP)
- [Work Opportunity Tax Credit](http://geographicsolutions.com/WOTC)
- [National Farmworker Jobs Program](http://geographicsolutions.com/NFJP)
- [Temporary Assistance for Needy Families](http://geographicsolutions.com/TANF)
- [Apprenticeships](https://www.geographicsolutions.com/Solutions/Federal-Programs/Apprenticeships)
- [OFCCP and EEOC Compliance](https://www.geographicsolutions.com/OFCCP)
- Services
- [Security & Hosting](https://www.geographicsolutions.com/Services/Security-Hosting)
- [Training](https://www.geographicsolutions.com/training)
- News & Events
- [Newsroom](https://www.geographicsolutions.com/News-Events/Newsroom)
- [Blog](https://www.geographicsolutions.com/News-Events/Blog)
- [Economist Corner](https://go.geographicsolutions.com/economist-corner)
- [Pinellas Tech Network](https://pinellastechnetwork.com/)
- [Industry Events](https://www.geographicsolutions.com/News-Events/Industry-Events)
- Resources
- [Pathways to Employment](https://go.geographicsolutions.com/pathwaystoemployment)
- [The Marketplace](https://go.geographicsolutions.com/marketplace)
- [Case Studies](https://go.geographicsolutions.com/casestudies)
- [Community Forum](https://community.geosolinc.com/)
- [VOScast Podcast](https://www.geographicsolutions.com/Resources/VOScast-Podcast)
- [Training Opportunities](https://www.geographicsolutions.com/Resources/Training-Opportunities)
- WTC 2026
- [About](https://www.geographicsolutions.com/2026-WTC)
- [Registration](https://www.geographicsolutions.com/WTC-2026/Registration)
- [Hotel & Travel](https://www.geographicsolutions.com/WTC-2026/Hotel-Travel)
- [Agenda](https://www.geographicsolutions.com/WTC-2026/Agenda)
- [Partnership Row](https://www.geographicsolutions.com/WTC-2026/Partnership-Row)
- Careers
- [Join Our Team](https://www.geographicsolutions.com/Careers/Join-Our-Team)
- [Current Openings](https://www.geographicsolutions.com/careers/current-openings)
- [Apprenticeships @ GSI](https://www.geographicsolutions.com/Careers/Apprenticeships-GSI)
- [Giving Back](https://www.geographicsolutions.com/careers/giving-back)
- [Contact Us](https://www.geographicsolutions.com/Contact-Us)
# Economist Corner

# Key Takeaways
- **Slower Job Growth Calls for More Deliberate Workforce Planning**: The U.S. economy added 152,000 jobs during the third quarter, with September contributing just 29,000. Downward revisions to July and August removed another 60,000 jobs from previous estimates, reinforcing the picture of subdued hiring. Unemployment ended the quarter at 4.2%, unchanged from June, while the report’s turnover indicators suggest employers remained cautious about both hiring and reducing staff.
- **A Growing Talent Pool Creates Opportunities to Rethink Recruitment**: Labor force participation increased from 61.5% in June to 61.8% in September, yet approximately 1.9 million people remained unemployed for at least 27 weeks. Meanwhile, Geographic Solutions’ data showed substantial increase in advertised job postings in professional and business services and trade-related industries. These findings suggest that recruiting activity continues in selected sectors even as some workers face prolonged difficulty securing employment.
- **Inflation is Raising the Stakes for Pricing and Pay Decisions**: Average hourly earnings increased approximately 0.6% during the quarter, while consumer prices rose about 1.1%, reducing the real hourly earnings by roughly 0.5%. Although retail spending increased, the report indicates that higher gasoline prices accounted for much of September’s growth. The implication for businesses is that rising sales revenue can coexist with pressure on customers’ purchasing power.
- State Employment Growth Reveals Widening Regional Disparities: Despite a broader national slowdown, South Carolina led third-quarter job growth with 31,500 new positions, nearly five times its historical average, while smaller states such as Mississippi, Nebraska and New Mexico posted exceptional gains. Significant losses in New York, Maryland and Texas underscore an increasingly uneven labor market, highlighting the importance of state-level trends in workforce planning and hiring decisions.
## Labor Market Insights
- The labor market continued to expand during the third quarter of 2026, but employment growth remained subdued and uneven. Total nonfarm employment increased by 152,000 over the quarter, with a decline of 10,000 jobs in July followed by gains of 133,000 in August and just 29,000 in September. Moreover, July and August employment estimates were revised downward by a combined 60,000 jobs, reinforcing concerns about the underlying strength of hiring. Although August's rebound temporarily suggested improving momentum, September's weak performance indicates that businesses remain cautious about expanding their workforces. Manufacturing, construction, trade/retail, and health care continued to provide some support, but employment growth was generally modest across most major industries.
- Labor market conditions showed signs of stabilization during the quarter, with modest improvements in labor force participation and broader measures of unemployment. The U-3 unemployment rate remained unchanged at 4.2% between June and September, after briefly declining to 4.1% in July and August. Meanwhile, the U-6 rate decreased from 7.9% to 7.6%, suggesting some improvement in labor underutilization. The labor force participation rate increased from 61.5% in June to 61.8% in September, reversing the weakness observed toward the end of the second quarter. This increase is particularly encouraging because unemployment remained relatively stable despite more people participating in the labor market. Average weekly hours for private-sector workers also increased slightly to 34.4 hours, although the limited change suggests that employers remain cautious about increasing labor demand.
- Other indicators suggest that nominal labor earnings continued to expand during the third quarter, although accelerating inflation eroded workers' purchasing power. Average hourly earnings for private-sector employees increased approximately 0.6%, reaching $37.81 in September, while a modest increase in average weekly hours provided additional support to nominal earnings. However, consumer prices increased approximately 1.1% during the quarter, outpacing wage growth and reducing real hourly earnings by roughly 0.5%. Inflation accelerated particularly sharply in September, when consumer prices rose 0.6%, largely reflecting higher energy costs. Taken together, the third quarter produced modest employment gains and some improvement in labor force participation, but weak payroll growth, continued downward revisions, and declining real purchasing power suggest that the labor market remains stable but vulnerable to further slowing.
## State-us Updates
- South Carolina led the nation in employment growth during the third quarter, adding 31,500 jobs, nearly five times its two-year average quarterly gain of 6,400. North Carolina also performed strongly, expanding by 15,300 jobs compared with its historical average of approximately 10,650. Washington followed closely, gaining 14,000 jobs, substantially exceeding its usual quarterly increase of roughly 3,000. These results indicate that employment growth remained relatively strong in several regional labor markets despite the broader national slowdown, with South Carolina emerging as a particularly significant contributor to third-quarter job creation.
- Several smaller states recorded exceptional employment gains relative to their recent performance. Mississippi added 5,900 jobs, more than thirteen times its two-year average quarterly increase of roughly 413, while Nebraska gained 3,200 jobs compared with its historical average of only 150. New Mexico also stood out, adding 8,200 jobs against its usual quarterly gain of approximately 800. Virginia experienced a notable reversal as well, expanding by 8,800 jobs after averaging quarterly losses of roughly 1,038 over the previous two years.
- New York experienced the largest employment decline during the third quarter, losing 12,200 jobs despite averaging quarterly gains of approximately 9,188 over the preceding two years. Maryland also struggled, shedding 9,900 jobs compared with its historical average decline of roughly 4,563, while Massachusetts lost 6,100 jobs. Texas recorded a particularly significant reversal, losing 5,100 jobs despite its two-year average quarterly increase of approximately 39,163. These results highlight considerable disparities in regional employment performance, with several large labor markets experiencing meaningful contractions even as smaller states recorded unusually strong gains.
###### Key Employment Insights
- **Payroll on the decline**
October’s largest payroll gains were in the Manufacturing and Professional & Business Services sectors. Transportation and Information Technology sectors saw the biggest decline.
- **Federal job cuts hampered employment growth in Q1**
The recent job cuts to the federal workforce has negatively impacted the country's overall employment growth in Q1. Based on recent data from the BLS, these cuts will continue to have a negative ripple affect throughout the rest of the year.
- **100k jobs lost due to recent natural disasters**
Nearly 100,000 individuals lost their jobs in Q1 due to the recent wildfires, hurricanes, and flash flood that have impacted most of the country.
###### Looking Ahead in Q2
- **Tariffs will continue to impact labor market**
Based on preliminary data from the BLS, the ongoing tariff war could result in the loss of nearly 100,000 jobs across the US in Q2 alone. As businesses continue to struggle with prices, we could expect an increase in layoffs to compensate for the higher overhead costs.
- **New legislation is expected to boost US employment**
New legislation proposed by the Trump administration to abolish taxes could result in a significant boost to the U.S. labor market, potentially adding one million jobs across the country.
- **Cutting interest rates could lead to recession**
If the Federal Reserve fails to achieve a soft landing in the coming months, economists predict it might send the country into a recession and result in the loss of thousands of jobs.
## Key Labor Market Insights
- **Two sectors cause a mild slowdown in hiring in Q2**
The mild slowdown in hiring over the past two quarters is due to a pullback in jobs within the Education & Health Services and the public sector, which accounted for nearly 74% of job growth in 2024.
- **Manufacturing, Trade, Transportation Hit by Tariffs First**
The Manufacturing and Trade, Transportation & Utilities sectors are expected to show the earliest effects from tariff policies. While both experienced losses in the second quarter, they do not appear to be major drivers of overall employment performance.
- **Private sector income dips amid economic worries**
In light of the unexpectedly strong job numbers in the face of less favorable economic conditions, it is important to look elsewhere for signs of diminishing labor market conditions. Real private-sector income (wages x hours) declined by 0.1%, owing to a 0.3% reduction in work hours, marking the first decline in 5 quarters. This might indicate that the declining economic outlook is starting to impact the market, but companies could be reducing work hours as a preemptive measure before implementing layoffs.
## Looking Ahead In Q3
- **Economists look for clarity amid changing policies**
Market watchers will be looking for signs on tariffs and interest rates for clarity on the direction of the economy. While the stop-go tariff maneuvers continue to add an extra degree of difficulty in projecting how the economy will perform over the next several months, the passage of the “One Big Beautiful Bill” extends most of the current tax rates that were set to expire this year.
- **Steady job growth expected for Q3 and Q4 2025**
Without knowing how these political developments will unfold, the economic data is pointing towards a similar pattern of job growth for the remainder of the year that we experienced in the second quarter. The Geographic Solutions forecast for the third quarter is 437,000 new jobs followed by 447,000 for the fourth quarter.
- **WSJ Economists Slightly Optimistic on US Growth**
Economists in the Wall Street Journal Survey are more upbeat than after the first quarter. Their latest recession probability assessment roughly splits their January and April assessments, putting the odds of a recession within the next 12 months at 33%.
- [National Employment - Quarterly](https://go.geographicsolutions.com/q3-2026-economist-corner-analysis#tab-1)
- [National Employment - Monthly](https://go.geographicsolutions.com/q3-2026-economist-corner-analysis#tab-2)
- [National Unemployment - Quarterly](https://go.geographicsolutions.com/q3-2026-economist-corner-analysis#tab-3)
- [National Unemployment - Monthly](https://go.geographicsolutions.com/q3-2026-economist-corner-analysis#tab-4)
- [Labor Force Participation Rate](https://go.geographicsolutions.com/q3-2026-economist-corner-analysis#tab-5)
- [U6 & U3 Unemployment Rates](https://go.geographicsolutions.com/q3-2026-economist-corner-analysis#tab-6)
*U-3 unemployment rate is the most commonly reported rate in the United States, representing the number of unemployed people actively seeking a job. The U-6 rate covers discouraged, underemployed, and unemployed workers in the country.*
## Employment FAQs
###### How have the federal job cuts impacted the labor market?
We will begin in this chapter by dealing with some general quantum mechanical ideas. Some of the statements will be quite precise, others only partially precise. It will be hard to tell you as we go along which is which, but by the time you have finished the rest of the book, you will understand in looking back which parts hold up and which parts were only explained roughly.
###### What are the implications of the tariff war from a labor perspective?
We will begin in this chapter by dealing with some general quantum mechanical ideas. Some of the statements will be quite precise, others only partially precise. It will be hard to tell you as we go along which is which, but by the time you have finished the rest of the book, you will understand in looking back which parts hold up and which parts were only explained roughly.
###### Will getting rid of taxes really jump start the labor market?
We will begin in this chapter by dealing with some general quantum mechanical ideas. Some of the statements will be quite precise, others only partially precise. It will be hard to tell you as we go along which is which, but by the time you have finished the rest of the book, you will understand in looking back which parts hold up and which parts were only explained roughly.
###### How optimistic are economists about the labor market in the coming months?
We will begin in this chapter by dealing with some general quantum mechanical ideas. Some of the statements will be quite precise, others only partially precise. It will be hard to tell you as we go along which is which, but by the time you have finished the rest of the book, you will understand in looking back which parts hold up and which parts were only explained roughly.

## Key Unemployment Insights
- **Steady as it goes**
Throughout Q1 2025, The unemployment rate has consistently remained low at 4%, indicating a stable job market, boosting economic growth and consumer confidence.
- **Shifting Job Vacancy Ratios**
The ratio of vacant jobs to jobless workers has decreased, indicating a shift in the labor market's dynamics. While still relatively tight, the market is becoming less intensely competitive for workers than it was previously
- **Changes in Voluntary Quits**
The rate of voluntary quits has decreased, suggesting that workers are becoming less inclined to leave their current jobs. This could indicate increased caution among workers due to economic uncertainty, or increased job satisfaction.
## Looking Ahead In Q2
- **Tariffs will continue to impact labor market**
While currently low, we anticipate the unemployment rate will gradually increase in Q2. However, this increase is expected to remain within a relatively narrow and historically healthy range.
- **Federal Reserve Actions**
If the Fed maintains or increases interest rates to combat inflation, it could lead to a slowdown in economic growth and potentially higher unemployment. Conversely, if the Fed begins to lower rates, it could stimulate growth and keep unemployment lower.
- **The Rise of Contract and Temporary Work**
An increase in contract and temporary hiring suggests that businesses may be adopting a more flexible approach to staffing, possibly due to economic uncertainty. This also shows that the "quality" of jobs, may be changing.
## Breaking it down Further
Despite mounting economic and geopolitical uncertainty, the national labor market notched another month of decent job gains and low unemployment. But there’s also potential trouble brewing beneath the surface of this report. Inflation remains stubbornly high and may yet climb higher. A rapid reversal in federal government hiring is showing signs of trickling down into state and local government hiring. And it remains uncomfortably difficult for unemployed people who want a job to quickly find one.
All eyes will likely be on federal employment, which officially fell by 10,000 in February. But the total reduction in federal employment was likely even larger last month, given the timing of data collection that happened towards the beginning of last month. Federal employment (minus post office workers) added an average of 6,400 jobs per month between July 2022 and March 2024, slowing to roughly 3,000/month towards the end of last year and then falling off a cliff last month. This federal slowdown is also showing signs of trickling down into state and local government hiring. Local government employment gains have fallen from an average of 36,000 jobs added per month between December 2023 and February 2024, to 18,000 in the past three months.
Going forward, the full impacts of all the new policies, proposals, and abrupt reversals that are the hallmarks of this administration will begin to shape the official statistics — good, bad, or indifferent. The market’s ability to maintain its “business as usual” momentum will be tested and the anticipated soft economic landing continues to hang in the balance.
- [National Unemployment - Quarterly](https://go.geographicsolutions.com/q3-2026-economist-corner-analysis#tab-1)
- [National Unemployment - Monthly](https://go.geographicsolutions.com/q3-2026-economist-corner-analysis#tab-2)
- [U6 & U3 Unemployment Rates](https://go.geographicsolutions.com/q3-2026-economist-corner-analysis#tab-3)
*U-3 unemployment rate is the most commonly reported rate in the United States, representing the number of unemployed people actively seeking a job. The U-6 rate covers discouraged, underemployed, and unemployed workers in the country.*
## Unemployment FAQs
###### How will the recent natural disasters affect the unemployment rate?
We will begin in this chapter by dealing with some general quantum mechanical ideas. Some of the statements will be quite precise, others only partially precise. It will be hard to tell you as we go along which is which, but by the time you have finished the rest of the book, you will understand in looking back which parts hold up and which parts were only explained roughly.
###### What is the current unemployment duration?
We will begin in this chapter by dealing with some general quantum mechanical ideas. Some of the statements will be quite precise, others only partially precise. It will be hard to tell you as we go along which is which, but by the time you have finished the rest of the book, you will understand in looking back which parts hold up and which parts were only explained roughly.
###### Will the federal job cuts impact people claiming unemployment benefits?
We will begin in this chapter by dealing with some general quantum mechanical ideas. Some of the statements will be quite precise, others only partially precise. It will be hard to tell you as we go along which is which, but by the time you have finished the rest of the book, you will understand in looking back which parts hold up and which parts were only explained roughly.
###### How optimistic are economists about the labor market in the coming months?
We will begin in this chapter by dealing with some general quantum mechanical ideas. Some of the statements will be quite precise, others only partially precise. It will be hard to tell you as we go along which is which, but by the time you have finished the rest of the book, you will understand in looking back which parts hold up and which parts were only explained roughly.
## Employment
- **In Brief:** October’s largest payroll losses were in the Manufacturing and Professional & Business Services sectors. Professional & Business Services fully recovered its loss in November (+3,000 over the last two months), but Manufacturing will have a longer path to regaining its jobs (-26,000 over the same period).
- **The Big Picture:** Private Education & Health Services and the Public sectors in November maintained the high growth we have seen over the last year and look to remain the primary job generators in the labor market heading into next year.
- **Diving in:** Despite mounting economic and geopolitical uncertainty, the national labor market notched another month of decent job gains and low unemployment. But there’s also potential trouble brewing beneath the surface of this report. Inflation remains stubbornly high and may yet climb higher. A rapid reversal in federal government hiring is showing signs of trickling down into state and local government hiring. And it remains uncomfortably difficult for unemployed people who want a job to quickly find one.
All eyes will likely be on federal employment, which officially fell by 10,000 in February. But the total reduction in federal employment was likely even larger last month, given the timing of data collection that happened towards the beginning of last month. Federal employment (minus post office workers) added an average of 6,400 jobs per month between July 2022 and March 2024, slowing to roughly 3,000/month towards the end of last year and then falling off a cliff last month. This federal slowdown is also showing signs of trickling down into state and local government hiring. Local government employment gains have fallen from an average of 36,000 jobs added per month between December 2023 and February 2024, to 18,000 in the past three months.
Going forward, the full impacts of all the new policies, proposals, and abrupt reversals that are the hallmarks of this administration will begin to shape the official statistics — good, bad, or indifferent. The market’s ability to maintain its “business as usual” momentum will be tested and the anticipated soft economic landing continues to hang in the balance.
## Unemployment
- **In Brief:**
- **What Does This Mean?:** An increasing unemployment rate (both U-3 & U-6) with a declining labor force participation rate is a worrying combination. It indicates that some who were previously looking for work have become discouraged and stopped, but even those who have remained in the labor force are finding it more difficult to be employed. This may be another symptom of the hurricanes as those who previously declared temporary unemployment later permanently left their jobs, and some of them may not have begun searching for new jobs yet.
## By the Numbers: Employment & Unemployment

## Key Employment Insights
- **Impact of California's Wildfires**
California lost 54,000 jobs in Q1 compared to its 2-year average of gaining 26,000 jobs per quarter. Much of this was likely caused by the devastating wildfires in Southern California in January that the state continues to recover from.
- **Federal cuts cause sharp decline in jobs in D.C.**
The District of Colombia had the most dramatic job loss relative to its usual pace of job creation, declining by 2,500 instead of the typical increase of 640. This drop is largely due to cuts in the federal workforce. Similarly, Virginia and Maryland, which have a large number of federal employees, finished the quarter well below their recent average.
- **Employment growth in Oregon & Ohio surge**
Oregon and Ohio experienced the highest job growth in Q1 and are the only two states to create more than twice the number of jobs they averaged over the past two years.
## What We're Forecasting
- **Tariffs will continue to impact labor market**
Based on preliminary data from the BLS, the ongoing tariff war could result in the loss of nearly 100,000 jobs across the US in Q2 alone. As businesses continue to struggle with prices, we could expect an increase in layoffs to compensate for the higher overhead costs.
- **New legislation is expected to boost US employment**
New legislation proposed by the Trump administration to abolish taxes could result in a significant boost to the U.S. labor market, potentially adding one million jobs across the country.
- **Cutting interest rates could lead to recession**
If the Federal Reserve fails to achieve a soft landing in the coming months, economists predict it might send the country into a recession and result in the loss of thousands of jobs.
## State-us Update
- The current economic focus on tariffs usually revolves around industries, but the effects of tariffs will undoubtedly have a geographic pattern as states have different concentrations of industries. The 2nd quarter employment changes in states and regions may illustrate this more fully if the tariff policies remain in place the entire time.
State Employment
State Unemployment

## Key Industry Insights
- **Payroll on the decline**
October’s largest payroll losses were in the Manufacturing and Professional & Business Services sectors. \[*Example Headline & Text\]*
- **Federal cuts leads to sharp decline in jobs**
The administration's initial actions to reduce the size of the federal workforce resulted in the loss of 12,000 jobs during the first quarter. \[*Example Headline & Text\]*
- **The Big Picture:** **Private Education & Health Services**
and the Public sectors in Q1 2025 maintained the high growth we have seen over the last year and look to remain the primary job generators in the labor market heading into next year. \[*Example Headline & Text\]*
## What We're Forecasting
- **Tariffs will continue to impact labor market**
The uncertainty of the current tariff landscape is expected to cause countless industries to make significant job cuts across the board. \[*Example Headline & Text\]*
- **New legislation is expected to boost US employment**
The government sector is expected to fully recovered its loss in Q1 2025, (+3,000 over the last two months), but Manufacturing will have a longer path to regaining its jobs (-26,000 over the same period). \[*Example Headline & Text\]*
- **Edu. job cuts could cause a recession**
The decline of Private Education & Health Services and the Public sectors in Q1 2025, cause result in a recession, according to the Wall Street Journal economists \[*Example Headline & Text\]*
## Stock Up:
- **Mining and Logging Sector:** In the first quarter of 2025, we've seen the mining and logging sector surge, adding one billion jobs. Specifically, the oil & gas extraction (+300,000) and the coal mining (+200,000) industries saw the largest increase in job openings since the new administration took office. This is the result of the administration large investment to maximize the use of the country's domestic resources, such as coal and oil. We can expect to see a steady increase in the coming months as well. \[*Example Headline & Text\]*
- **Manufacturing:** The manufacturing sector (+600,000) significantly increased in Q1 2025 due to the recent rise in companies continueing to invest in manufacturing their goods in the US. The semiconductor and electronic components (+500,000) industry saw the largest increase in jobs due to the high tariffs placed on China. Wood products (+35,000) also saw a substantial rise as a result of recent research that shows wooden products are vastly superiors to metal ones. \[*Example Headline & Text\]*
- **Leisure & Hospitality:** Employment in Leisure & Hospitality (+70,000) increased sharply in the first quarter. Food services and drinking places (restaurants and bars) continues its run of strong hiring, making up 28,900 jobs created in Leisure & Hospitality for Q1. This is due to XYZ. \[*Example Headline & Text\]*
## Stock Down:
- **Government Sector:** The administration's initial actions to reduce the size of the federal workforce resulted in the loss of 12,000 jobs during the first quarter. While it is uncertain whether this pace of cuts will continue in the foreseeable future, there is potential for more employees to accept buyout agreements. Additionally, the administration has suggested the possibility of closing down operations of the Department of Education that are not explicitly mandated by federal law. \[Can you add in more data/detail about the job losses so it's different from Labor Market Overview Section\]
- **The Retail Sector:** The retail sector appears to be reacting swiftly to the current tariff environment, with retail trade experiencing a 12.5% drop (approximately 80,000) in job openings during the first quarter. It is atypical for price increases resulting from supply disruptions to affect retail job openings before impacting manufacturing jobs; however, this scenario is plausible. \[Can you add in more data/detail about the job losses so it's different from Labor Market Overview Section\]
- **Construction Sector:** Similar to the retail sector, construction saw a sharp decline in job openings (-800,000) due to the current tariff environment. As the cost of materials continues to grow, we can expect construction to slow down in the U.S., which could result in the loss of even more jobs. \[*Example Headline & Text\]*
# **Employment By Industry**
## Stock Up
Other Filter Filter Filter Filter Filter

### Professional & Business Services
The sector gained 20,000 employees, reversing average quarterly losses of over 31,000 employeesover the past two years. Much of this addition was due to the increase in employment in Administrative & Support Services and Administration and Waste Services.
### Financial Activities
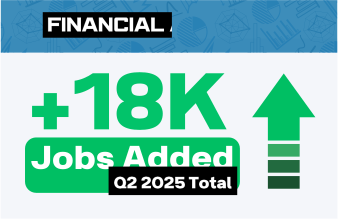
Payroll employment in this sector increased by 18,000 between Q1 and Q2, marking a higher-than-anticipated growth rate in the first half of the year. Multiple subsectors contributed, notably Rental and Leasing (both Real Estate and Services) and Credit Intermediation and Related Activities.

### Information Technology
This sector’s employment saw a gain of 9,000 - defying an expected loss. Increases in employment in Motion Picture and Sound Recording Industries, Internet Publishing and Broadcasting, and Telecommunications industries drove the bulk of this growth.
- [Employment by Industry - Quarterly](https://go.geographicsolutions.com/q3-2026-economist-corner-analysis#tab-1)
- [Employment by Industry - Monthly](https://go.geographicsolutions.com/q3-2026-economist-corner-analysis#tab-2)

## Quarterly Performance



## Two-Year Quarterly Average




## Quarterly Performance



## Two-Year Quarterly Average



## Stock Down
## Stock Down
Other Filter Filter Filter Filter Filter

### Government
The sector did see an employment increase of 105,000, but growth for the previous quarter continues to trend below average. Continued cuts in the Federal subsectors drive overall growth down, though increases in State and Local government sectors have offset a large portion of the decline.

### Construction
Though the sector’s payroll employment grew by 21,000, lower-than-anticipated performance in many of the major subsectors (Specialty Trade Contractors, Heavy and Civil Engineering Construction, Construction of Buildings) prevented the growth from reaching the average increase of previous quarters.
### Transportation and Warehousing
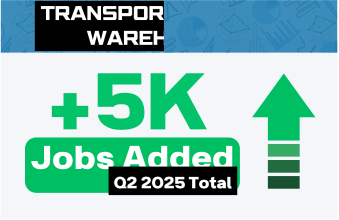
Employment was still positive at a gain of 5,000 employees, but this falls well below the average quarterly gain from the past two years. This could signal responses to changes in consumer spending, driving shifts in the volume of goods being shipped or stored.
## Industries on the Rise
###### Trade, Transportation, and Utilities | +78,000
The sector absorbed the second largest increase in jobs, +78,000, versus the long-run average of -25,620 jobs. The three subsectors within this industry trailing ahead of others are Couriers and Messengers (+22,900), Warehousing and Storage (+13,300), and General Merchandise Retailers (+10,100).
###### Professional and Business Services | +62,000
This industry underwent the third largest spike in employment, at +62,000, reversing the historical average of -23,880. Most of the growth occurred in Employment Services (+29,900), almost symmetrical to its long-run average of -26,040. Other notable subgroups include Management, Scientific, and Technical Consulting Services (+12,700) and Office Administrative Services (+11,100).
###### Manufacturing | +10,000
Employment modestly increased by 10,000, directionally flipping the past average decrease of -29,750 jobs. The top three most well-performing sectors are Computer and Electronic Product Manufacturing (+5,300 versus two-year average of -5,200), Transportation Equipment Manufacturing (+1,900 versus past average decrease of -6,000), and Chemical Manufacturing (+6,800).
## Industries on the Decline
###### Private Education and Health Services | 141,000
Payroll employment grew the most out of all industries at +141,000, lagging its historical increase of +195,880 jobs. The top three underperformers are Social Assistance (+47,000 vs historical average +67,540), Ambulatory Health Care Services (+42,700 vs historical average +62,960), and Hospitals (+16,000 vs historical average +31,310).
###### Leisure & Hospitality | -19,000
This sector underwent a modest decline in number of jobs over the past quarter, with the figure being -19,000, while its historical performance was directionally opposite to it, at +24,880. Three subindustries bore changes in the negatives: Accommodation (-20,300), Performing Arts, Spectator Sports, and Related Industries (-15,300), and Amusement, Gambling, and Recreation Industries (-8,200).
###### Financial Activities | -24,000
Compared to all other industries nationally, FA took the second hardest hit into the negatives- an output of -24,000 jobs over the past quarter, more so in absolute magnitude than its historical loss of -2,120. The two groups in this industry that dipped the most are Insurance Carriers and Related Activities (-23,900) and Real Estate (-5,200).
# **Job Postings By Industry**
## Job Postings on the Rise
###### Professional and Business Services | +170,038
GSI tracked the number of listings within this industry which increased by 170,038, while its historical increase was 8,505 listings. The two subsectors spearheading the broader increase are Professional, Scientific, and Technical Services (+118,333) and Administrative and Support Services (+49,774).
###### Trade, Transportation and Utilities | +123,000
Tracked listings increased by 123,000, dramatically outpacing its historical record of +11,666. The top three overperformers are Food and Beverage Retailers (+21,660), General Merchandise Retailers (+27,681), and Clothing, Clothing Accessories, Shoe, and Jewelry Retailers (+14,679).
###### Private Education and Health Services | +56,393
Geographic Solutions’ Job postings for Manufacturing grew precipitously by 86,116. This can be cited as a clear distinction from its two-year average growth of roughly 1,291 jobs being posted online. The four leading subsectors are Machinery Manufacturing (+51,120), Computer and Electronic Product Manufacturing (+15,720), Transportation Equipment Manufacturing (+7,772), and Chemical Manufacturing (+4,646).
## Job Postings on the Decline
###### Manufacturing | +9,556
GSI tracked the number of listings within this industry which increased by 170,038, while its historical increase was 8,505 listings. The two subsectors spearheading the broader increase are Professional, Scientific, and Technical Services (+118,333) and Administrative and Support Services (+49,774).
###### Mining and Logging | +433
GSI-tracked listings barely increased over the last quarter, with the figure being only +433. There are three subsectors in the aggregate industry, all experiencing minimal traction: Support Activities for Mining (-90), Mining (except Oil and Gas) (+101), and Oil and Gas Extraction (+440).
###### Information | +8,523
As with the aforementioned sector, there is a minimal surge in listings in Information. Postings increased by 8,523. The top three underperformers are Motion Picture and Sound Recording Industries (-763), Broadcasting and Content Providers(-302), and Web Search Portals, Libraries, Archives, and Other Information Services (+352).
## Breaking it Down Further
Consumer spending remained surprisingly resilient during the third quarter, although rising prices increasingly complicated the interpretation of that strength. Retail and food services sales increased 0.8 percent in September, contributing to a 5.5 percent increase for the quarter compared with the same period in 2025. However, higher gasoline prices accounted for much of September's growth, suggesting that spending gains did not necessarily translate into greater consumption. Inflation accelerated to 3.7% annually in September, driven partly by disruptions to energy markets associated with the conflict involving Iran. These pressures reduced household purchasing power and raised concerns that consumers could become more selective with discretionary spending, potentially weakening demand for workers in retail, hospitality, and other consumer-facing industries.
Employers became increasingly reluctant to expand their workforces as the quarter progressed, despite a temporary improvement in August. September's modest employment increase of 29,000 followed a much stronger August, while July registered a small decline. The resulting quarterly expansion was considerably weaker than during the preceding three months, suggesting that businesses were approaching hiring decisions with greater caution. Nevertheless, unemployment remained relatively stable, ending September at 4.%, essentially unchanged from June. This combination indicates that employers were generally retaining existing employees rather than undertaking widespread workforce reductions. While this provided some stability, the absence of stronger hiring raises concerns about opportunities for new labor market entrants and unemployed workers seeking to return to employment.
Improvements in workforce participation offered a somewhat more encouraging perspective on labor market conditions than payroll figures alone. The labor force participation rate recovered from its June low of 61.5 percent to 61.8 percent in September, while the broader U-6 unemployment rate declined from 7.9 percent to 7.6 percent. These movements suggest that labor underutilization decreased even as more individuals entered or returned to the workforce. However, the benefits were not distributed evenly. Long-term unemployment remained elevated, with approximately 1.9 million individuals unemployed for at least 27 weeks in September. The divergence suggests that the labor market was becoming more accessible to some workers while others continued to experience difficulty finding suitable employment, particularly as employers limited recruitment.
Employment trends differed substantially across industries, with goods-producing and distribution-related businesses demonstrating greater resilience than several major service industries. Manufacturing and construction benefited from continuing investment activity, while trade, transportation, and utilities also contributed to employment growth. By comparison, financial activities and information services experienced weakness, and health care hiring moderated from its previously strong pace. This divergence was also apparent in advertised job openings, where professional and business services and trade-related industries recorded substantial increases in postings despite relatively subdued overall employment growth. The contrast suggests that businesses continued identifying workforce needs but were not necessarily translating recruitment activity into immediate hiring. Looking ahead, industry performance will increasingly depend on whether business investment can offset weaker consumer demand and elevated financing costs.
The combination of slowing employment growth and accelerating inflation created a particularly difficult environment for monetary policy. In September, the Federal Reserve increased its benchmark interest rate by a quarter percentage point, bringing the target range to 3.75–4.00 percent as inflation remained above its long-term objective. Higher borrowing costs could further restrain business expansion, construction activity, and hiring, even as wage growth struggles to keep pace with rising consumer prices. Meanwhile, JOLTS data showed job openings near 7.1 million in August, with relatively little movement in hiring, quits, or layoffs. These conditions point toward a labor market characterized more by limited worker turnover than widespread job losses. Entering the fourth quarter, the central concern is whether persistent inflation and restrictive financial conditions will prolong hiring weakness or eventually produce a more pronounced increase in unemployment.
Overall, the third quarter of 2026 revealed a U.S. labor market that remains vulnerable to economic pressures. Employment growth slowed considerably, although the absence of widespread layoffs and improvements in labor force participation provided some reassurance. Manufacturing, construction, and trade-related industries demonstrated resilience, while several service industries struggled to maintain momentum. Meanwhile, rising energy prices associated with the Iranian conflict contributed to accelerating inflation, eroding real wages and threatening consumer purchasing power. These developments present a difficult challenge for the Federal Reserve, as higher interest rates intended to contain inflation could further discourage business investment and hiring. Looking at the fourth quarter, the outlook will depend heavily on whether inflationary pressures ease and businesses regain confidence in expanding their workforces. Without improvement in these conditions, today's subdued hiring environment could gradually translate into higher unemployment and weaker consumer demand.
*Geographic Solutions aggregates and analyzes the following proprietary employment metrics from internal data on the number of advertised job openings posted on Geographic Solutions' state client sites.*
Other Filter Filter Filter Filter Filter
### Health Care and Social Assistance
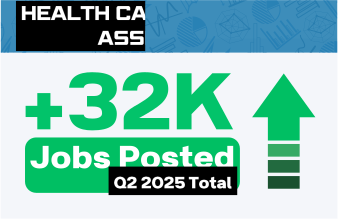
According to Geographic Solutions’ online advertised job postings, Education Services saw an increase of 28,104 positions. While this exceeds the average growth seen in previous quarters, this aligns with hiring expectations as schools list positions in Q2 and Q3 for the upcoming school year.

### Education Services
Although job postings in this industry dropped by 32,383 compared to the previous quarter, this decrease is significantly lower than declines observed in other quarters over the past two years. Combined with June 2025 BLS employment information from CES, this continues to support the theory that employment in this industry is stabilizing.

### Information Technology
Geographic Solutions’ Job postings for the Information industry increased by 5,482 listings, rather than decreasing as expected. This may signal that employment growth in this industry will continue, which aligns with the BLS employment data.
### Professional, Scientific, and Technical Services
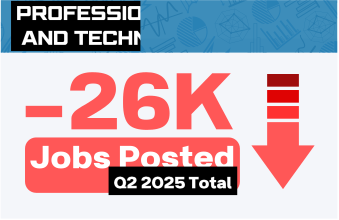
Geographic Solutions advertised job postings in this sector declined by 15,043, representing a higher-than-average loss compared to previous quarterly changes. Policy changes and uncertain funding may be impacting employer decisions to post these positions.
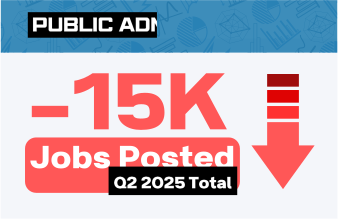
### Public Administration
Geographic Solutions’ postings saw a decline of 26,256 listings. The decline in postings, combined with increased employment in the Professional and Business Services series, could indicate that companies are experiencing less turnover than in previous quarters.
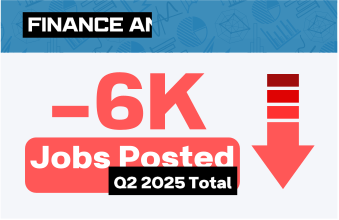
### Finance and insurance
This category saw a decline of 6,342 postings, an above-average loss compared to previous quarters. Like the previous sector \[Professional, Scientific, and Technical Services\], the decline in listings coupled with an above average employment performance in the Financial Activities could indicate higher retention rates for companies in this sector, or budget caution in an uncertain economy.
---
*Geographic Solutions derives its employment forecast and unemployment rate forecast from internal data on the number of job openings, searchers, and employment and unemployment applications filed on Geographic Solutions' state client sites. The forecast uses unemployment claims data from the U.S. Department of Labor (USDOL).*
# **Meet Our Economist**
Phillip Sprehe is the Lead Economist at Geographic Solutions. Throughout his tenure with Geographic Solutions, he has been successful in assessing macroeconomic data and financial markets for the entire country. He has been able to accurately predict the economic impacts of the labor market by monitoring key economic indicators as well as analyzing internal and publicly available data, such as unemployment claims, United States Treasuries, equity markets, and COVID-19 metrics.
Phillip's research has been featured globally by news outlets, both in print and broadcast. Publications and networks include Business Insider, CNET, ConsumerAffairs, Le Monde, GoBankingRates, and The Daily Express US. His commentaries routinely have higher prediction proximity than large media outlets like The Wall Street Journal.

# Contact Us
Are you enjoying our economists' insights and analysis? Interested in having them speak or provide content for podcast, television, internet, or other mediums? Please email us using this form.
## Previous Monthly Reports
- December 2024 - [Forecast](https://go.geographicsolutions.com/economist-corner-forecast-december-2024?hsLang=en)| [Analysis](https://go.geographicsolutions.com/economist-corner-december-analysis-2024?hsLang=en)
- November 2024 - [Forecast](https://go.geographicsolutions.com/economist-corner-forecast-november-2024?hsLang=en)| [Analysis](https://go.geographicsolutions.com/economist-corner-november-analysis-2024?hsLang=en)
- October 2024 - [Forecast](https://go.geographicsolutions.com/economist-corner-forecast-november-2024?hsLang=en)| [Analysis](https://go.geographicsolutions.com/economist-corner-analysis-october-2024?hsLang=en)
- September 2024 - [Forecast](https://go.geographicsolutions.com/economist-corner-forecast-september-2024?hsLang=en)| [Analysis](https://go.geographicsolutions.com/economist-corner-analysis-september-2024?hsLang=en)
- August 2024 - [Forecast](https://go.geographicsolutions.com/economist-corner-forecast-august-2024?hsLang=en)| [Analysis](https://go.geographicsolutions.com/economist-corner-analysis-august-2024?hsLang=en)
- July 2024 - [Forecast](https://go.geographicsolutions.com/economist-corner-forecast-july-2024?hsLang=en)| [Analysis](https://go.geographicsolutions.com/economist-corner-analysis-july-2024?hsLang=en)
- June 2024 - [Forecast](https://go.geographicsolutions.com/economist-corner-forecast-june-2024?hsLang=en)| [Analysis](https://go.geographicsolutions.com/economist-corner-analysis-june-2024?hsLang=en)
- May 2024 - [Forecast](https://go.geographicsolutions.com/economist-corner-forecast-may-2024-0?hsLang=en)| [Analysis](https://go.geographicsolutions.com/economist-corner-analysis-may-2024?hsLang=en)
- April 2024 - [Forecast](https://go.geographicsolutions.com/economist-corner-forecast-april-2024?hsLang=en)| [Analysis](https://go.geographicsolutions.com/economist-corner-analysis-april-2024?hsLang=en)
- March 2024 - [Forecast](https://go.geographicsolutions.com/economist-corner-forecast-march-2024?hsLang=en)| [Analysis](https://go.geographicsolutions.com/economist-corner-analysis?hsLang=en)
### *Building Integrated Workforce Development Systems*
#### **Company**
[About Us](https://www.geographicsolutions.com/Company/About-Us)
[Clients](https://www.geographicsolutions.com/Company/Clients)
[Partnerships](https://www.geographicsolutions.com/Company/Partnerships)
#### **Resources**
[Training Ops](https://www.geographicsolutions.com/Resources/Training-Opportunities)
[Newsroom](https://www.geographicsolutions.com/News-Events/Newsroom)
[Blog](https://www.geographicsolutions.com/News-Events/Blog)
#### **Careers**
[Corporate Culture](https://www.geographicsolutions.com/Careers/Corporate-Culture)
[Current Openings](https://www.geographicsolutions.com/Careers/Current-Openings)
[Apprenticeships](https://www.geographicsolutions.com/Careers/Apprenticeships-GSI)
#### [**Contact Us**](https://www.geographicsolutions.com/Contact-Us)
2570 Coral Landings Blvd. Palm Harbor, FL 34684
[727-786-7955 (Headquarters)](tel:+1-727-786-7955)
[+44-114-463-0004 (UK Office)](tel:+44-114-463-0004)
[Request More Information](https://go.geographicsolutions.com/request-a-demo?hsLang=en)
[Media Inquiry](mailto:mediainquiry@geosolinc.com?subject=Media%20Inquiry%20for%20Geographic%20Solutions%20)
[Sitemap](https://www.geographicsolutions.com/GSI-Sitemap)
#### **Follow Us**
- [Facebook](https://www.facebook.com/GeographicSolutions)
- [Twitter](https://www.twitter.com/geosolutionsinc)
- [LinkedIn](https://www.linkedin.com/company/geographic-solutions)
- [YouTube](https://www.youtube.com/channel/UCb7sPmEsVVt4QfzA8SK7YdQ)
© 1998-2026 Geographic Solutions, Inc. All rights reserved. [Terms Of Use](https://www.geographicsolutions.com/terms) [Privacy Statement](https://www.geographicsolutions.com/privacy)