
.gif "The Economist Corner Quarterly Report Q2 2026")
Key Takeaways
-
Job Growth Showed Improvement, but Momentum Faded by Quarter's End: The U.S added 334,000 jobs in the second quarter, a solid improvement over Q1. But the pace cooled quickly, dropping from strong gains in April and May to just 57,000 jobs in June. With earlier estimates also revised downward, the quarter ended with more of a slowdown than a surge.
-
Lower Unemployment Masked by Declining Workforce Participation: The unemployment rate edged down to 4.2%, which looks encouraging at first glance. However, labor force participation also fell to 61.5%, with roughly 72,000 people leaving the labor force in June alone. In other words, the lower unemployment rate came with an important catch: fewer people were actively looking for work.
-
Uneven Growth Across States and Industries: Second-quarter gains were concentrated in Texas and Minnesota, delivering standout job growth, while California posted the quarter's largest employment decline. Trade, Transportation, and Utilities, Professional and Business Services, and Government helped drive gains, while Leisure and Hospitality and Financial Activities moved in the opposite direction. The result was a quarter of continued growth, but one with clear winners, losers, and widening gaps across the labor market.
Labor Market Overview
Labor Market Insights
-
The labor market strengthened further in the second quarter of 2026, although momentum weakened considerably by the end of the period. Total nonfarm employment increased by 334,000 over the quarter, compared with a gain of 218,000 in the first quarter. Hiring was especially strong in April and May before slowing to just 57,000 jobs in June, and the earlier estimates for April and May were revised downward by a combined 74,000. Taken together, the results represent a meaningful improvement from late 2025, but June’s slowdown suggests that the stronger spring hiring pace may not be sustained.
-
The U-3 unemployment rate declined from 4.3% in March to 4.2% in June, while the U-6 rate edged down from 8.0% to 7.9%. Those improvements were modest and were accompanied by another pronounced decline in labor supply. The labor force participation rate fell from 61.9% to 61.5%, including a 0.3-percentage-point drop in June alone, as roughly 720,000 people exited the labor force that month. Consequently, the lower unemployment rate does not necessarily indicate that job-finding conditions improved materially. Average weekly hours for private-sector workers increased slightly to 34.3 hours, but remained within the narrow range that has prevailed for much of the past two years.
-
Other indicators show that nominal earnings continued to rise, but workers' purchasing power faced renewed pressure during much of the quarter. Average hourly earnings for private-sector employees increased by approximately 0.8%, reaching $37.64 in June, while the combination of rising wages, slightly longer hours, and additional employment lifted aggregate nominal private-sector earnings. However, the energy-price shock associated with the Iranian conflict caused inflation to accelerate sharply in May, offsetting much of the improvement in labor income before prices declined in June. Overall, the second quarter produced stronger employment and earnings growth than the first, but falling participation, downward payroll revisions, and the sharp deceleration in June point to a labor market that remains resilient rather than one undergoing a broad-based acceleration.
State-us Updates
- Texas was the strongest state in absolute terms during the second quarter, adding 75,600 jobs, nearly double its two-year average quarterly gain of roughly 38,100. Minnesota also had a standout quarter, expanding by 41,900 jobs compared with its usual two-year average increase of only 1,600. Together, these two states accounted for a large share of the quarter’s state-level employment strength and suggest that job growth remained concentrated in a relatively small number of high-performing labor markets.
- Several smaller and mid-sized states also posted unusually strong gains relative to their recent histories. Missouri added 18,800 jobs despite averaging a slight quarterly decline of about 500 over the previous two years, while Kansas gained 12,800 jobs, compared with a two-year average increase of only 450. New Hampshire also performed well, adding 8,100 jobs after averaging quarterly losses of roughly 725, indicating that some of the quarter's best performances came from states reversing prior weakness.
- California lost 18,500 jobs in the second quarter despite averaging gains of roughly24,300 jobs over the prior two years, making it the largest absolute negative swing. Montana also stood out negatively, losing 3,600 jobs after averaging slight quarterly gains, while North Dakota lost 4,000 jobs despite typically adding about 700. These declines show that second-quarter employment strength was far from evenly distributed across states
Key Employment Insights
- Payroll on the decline
October’s largest payroll gains were in the Manufacturing and Professional & Business Services sectors. Transportation and Information Technology sectors saw the biggest decline. - Federal job cuts hampered employment growth in Q1
The recent job cuts to the federal workforce has negatively impacted the country's overall employment growth in Q1. Based on recent data from the BLS, these cuts will continue to have a negative ripple affect throughout the rest of the year. - 100k jobs lost due to recent natural disasters
Nearly 100,000 individuals lost their jobs in Q1 due to the recent wildfires, hurricanes, and flash flood that have impacted most of the country.
Looking Ahead in Q2
- Tariffs will continue to impact labor market
Based on preliminary data from the BLS, the ongoing tariff war could result in the loss of nearly 100,000 jobs across the US in Q2 alone. As businesses continue to struggle with prices, we could expect an increase in layoffs to compensate for the higher overhead costs.
- New legislation is expected to boost US employment
New legislation proposed by the Trump administration to abolish taxes could result in a significant boost to the U.S. labor market, potentially adding one million jobs across the country. - Cutting interest rates could lead to recession
If the Federal Reserve fails to achieve a soft landing in the coming months, economists predict it might send the country into a recession and result in the loss of thousands of jobs.
Key Labor Market Insights
- Two sectors cause a mild slowdown in hiring in Q2
The mild slowdown in hiring over the past two quarters is due to a pullback in jobs within the Education & Health Services and the public sector, which accounted for nearly 74% of job growth in 2024. - Manufacturing, Trade, Transportation Hit by Tariffs First
The Manufacturing and Trade, Transportation & Utilities sectors are expected to show the earliest effects from tariff policies. While both experienced losses in the second quarter, they do not appear to be major drivers of overall employment performance. - Private sector income dips amid economic worries
In light of the unexpectedly strong job numbers in the face of less favorable economic conditions, it is important to look elsewhere for signs of diminishing labor market conditions. Real private-sector income (wages x hours) declined by 0.1%, owing to a 0.3% reduction in work hours, marking the first decline in 5 quarters. This might indicate that the declining economic outlook is starting to impact the market, but companies could be reducing work hours as a preemptive measure before implementing layoffs.
Looking Ahead In Q3
- Economists look for clarity amid changing policies
Market watchers will be looking for signs on tariffs and interest rates for clarity on the direction of the economy. While the stop-go tariff maneuvers continue to add an extra degree of difficulty in projecting how the economy will perform over the next several months, the passage of the “One Big Beautiful Bill” extends most of the current tax rates that were set to expire this year.
- Steady job growth expected for Q3 and Q4 2025
Without knowing how these political developments will unfold, the economic data is pointing towards a similar pattern of job growth for the remainder of the year that we experienced in the second quarter. The Geographic Solutions forecast for the third quarter is 437,000 new jobs followed by 447,000 for the fourth quarter. - WSJ Economists Slightly Optimistic on US Growth
Economists in the Wall Street Journal Survey are more upbeat than after the first quarter. Their latest recession probability assessment roughly splits their January and April assessments, putting the odds of a recession within the next 12 months at 33%.
- National Employment - Quarterly
- National Employment - Monthly
- National Unemployment - Quarterly
- National Unemployment - Monthly
- Labor Force Participation Rate
- U6 & U3 Unemployment Rates
Employment FAQs
How have the federal job cuts impacted the labor market?
We will begin in this chapter by dealing with some general quantum mechanical ideas. Some of the statements will be quite precise, others only partially precise. It will be hard to tell you as we go along which is which, but by the time you have finished the rest of the book, you will understand in looking back which parts hold up and which parts were only explained roughly.
What are the implications of the tariff war from a labor perspective?
We will begin in this chapter by dealing with some general quantum mechanical ideas. Some of the statements will be quite precise, others only partially precise. It will be hard to tell you as we go along which is which, but by the time you have finished the rest of the book, you will understand in looking back which parts hold up and which parts were only explained roughly.
Will getting rid of taxes really jump start the labor market?
We will begin in this chapter by dealing with some general quantum mechanical ideas. Some of the statements will be quite precise, others only partially precise. It will be hard to tell you as we go along which is which, but by the time you have finished the rest of the book, you will understand in looking back which parts hold up and which parts were only explained roughly.
How optimistic are economists about the labor market in the coming months?
We will begin in this chapter by dealing with some general quantum mechanical ideas. Some of the statements will be quite precise, others only partially precise. It will be hard to tell you as we go along which is which, but by the time you have finished the rest of the book, you will understand in looking back which parts hold up and which parts were only explained roughly.

Key Unemployment Insights
- Steady as it goes
Throughout Q1 2025, The unemployment rate has consistently remained low at 4%, indicating a stable job market, boosting economic growth and consumer confidence. - Shifting Job Vacancy Ratios
The ratio of vacant jobs to jobless workers has decreased, indicating a shift in the labor market's dynamics. While still relatively tight, the market is becoming less intensely competitive for workers than it was previously - Changes in Voluntary Quits
The rate of voluntary quits has decreased, suggesting that workers are becoming less inclined to leave their current jobs. This could indicate increased caution among workers due to economic uncertainty, or increased job satisfaction.
Looking Ahead In Q2
- Tariffs will continue to impact labor market
While currently low, we anticipate the unemployment rate will gradually increase in Q2. However, this increase is expected to remain within a relatively narrow and historically healthy range.
- Federal Reserve Actions
If the Fed maintains or increases interest rates to combat inflation, it could lead to a slowdown in economic growth and potentially higher unemployment. Conversely, if the Fed begins to lower rates, it could stimulate growth and keep unemployment lower. - The Rise of Contract and Temporary Work
An increase in contract and temporary hiring suggests that businesses may be adopting a more flexible approach to staffing, possibly due to economic uncertainty. This also shows that the "quality" of jobs, may be changing.
Breaking it down Further
Despite mounting economic and geopolitical uncertainty, the national labor market notched another month of decent job gains and low unemployment. But there’s also potential trouble brewing beneath the surface of this report. Inflation remains stubbornly high and may yet climb higher. A rapid reversal in federal government hiring is showing signs of trickling down into state and local government hiring. And it remains uncomfortably difficult for unemployed people who want a job to quickly find one.All eyes will likely be on federal employment, which officially fell by 10,000 in February. But the total reduction in federal employment was likely even larger last month, given the timing of data collection that happened towards the beginning of last month. Federal employment (minus post office workers) added an average of 6,400 jobs per month between July 2022 and March 2024, slowing to roughly 3,000/month towards the end of last year and then falling off a cliff last month. This federal slowdown is also showing signs of trickling down into state and local government hiring. Local government employment gains have fallen from an average of 36,000 jobs added per month between December 2023 and February 2024, to 18,000 in the past three months.
Going forward, the full impacts of all the new policies, proposals, and abrupt reversals that are the hallmarks of this administration will begin to shape the official statistics — good, bad, or indifferent. The market’s ability to maintain its “business as usual” momentum will be tested and the anticipated soft economic landing continues to hang in the balance.
Unemployment FAQs
How will the recent natural disasters affect the unemployment rate?
We will begin in this chapter by dealing with some general quantum mechanical ideas. Some of the statements will be quite precise, others only partially precise. It will be hard to tell you as we go along which is which, but by the time you have finished the rest of the book, you will understand in looking back which parts hold up and which parts were only explained roughly.
What is the current unemployment duration?
We will begin in this chapter by dealing with some general quantum mechanical ideas. Some of the statements will be quite precise, others only partially precise. It will be hard to tell you as we go along which is which, but by the time you have finished the rest of the book, you will understand in looking back which parts hold up and which parts were only explained roughly.
Will the federal job cuts impact people claiming unemployment benefits?
We will begin in this chapter by dealing with some general quantum mechanical ideas. Some of the statements will be quite precise, others only partially precise. It will be hard to tell you as we go along which is which, but by the time you have finished the rest of the book, you will understand in looking back which parts hold up and which parts were only explained roughly.
How optimistic are economists about the labor market in the coming months?
We will begin in this chapter by dealing with some general quantum mechanical ideas. Some of the statements will be quite precise, others only partially precise. It will be hard to tell you as we go along which is which, but by the time you have finished the rest of the book, you will understand in looking back which parts hold up and which parts were only explained roughly.
Employment
- In Brief: October’s largest payroll losses were in the Manufacturing and Professional & Business Services sectors. Professional & Business Services fully recovered its loss in November (+3,000 over the last two months), but Manufacturing will have a longer path to regaining its jobs (-26,000 over the same period).
- The Big Picture: Private Education & Health Services and the Public sectors in November maintained the high growth we have seen over the last year and look to remain the primary job generators in the labor market heading into next year.
- Diving in: Despite mounting economic and geopolitical uncertainty, the national labor market notched another month of decent job gains and low unemployment. But there’s also potential trouble brewing beneath the surface of this report. Inflation remains stubbornly high and may yet climb higher. A rapid reversal in federal government hiring is showing signs of trickling down into state and local government hiring. And it remains uncomfortably difficult for unemployed people who want a job to quickly find one.
All eyes will likely be on federal employment, which officially fell by 10,000 in February. But the total reduction in federal employment was likely even larger last month, given the timing of data collection that happened towards the beginning of last month. Federal employment (minus post office workers) added an average of 6,400 jobs per month between July 2022 and March 2024, slowing to roughly 3,000/month towards the end of last year and then falling off a cliff last month. This federal slowdown is also showing signs of trickling down into state and local government hiring. Local government employment gains have fallen from an average of 36,000 jobs added per month between December 2023 and February 2024, to 18,000 in the past three months.
Going forward, the full impacts of all the new policies, proposals, and abrupt reversals that are the hallmarks of this administration will begin to shape the official statistics — good, bad, or indifferent. The market’s ability to maintain its “business as usual” momentum will be tested and the anticipated soft economic landing continues to hang in the balance.
Unemployment
- In Brief:
- What Does This Mean?: An increasing unemployment rate (both U-3 & U-6) with a declining labor force participation rate is a worrying combination. It indicates that some who were previously looking for work have become discouraged and stopped, but even those who have remained in the labor force are finding it more difficult to be employed. This may be another symptom of the hurricanes as those who previously declared temporary unemployment later permanently left their jobs, and some of them may not have begun searching for new jobs yet.
By the Numbers: Employment & Unemployment
.png "State-Us Update")
Key Employment Insights
- Impact of California's Wildfires
California lost 54,000 jobs in Q1 compared to its 2-year average of gaining 26,000 jobs per quarter. Much of this was likely caused by the devastating wildfires in Southern California in January that the state continues to recover from. - Federal cuts cause sharp decline in jobs in D.C.
The District of Colombia had the most dramatic job loss relative to its usual pace of job creation, declining by 2,500 instead of the typical increase of 640. This drop is largely due to cuts in the federal workforce. Similarly, Virginia and Maryland, which have a large number of federal employees, finished the quarter well below their recent average. - Employment growth in Oregon & Ohio surge
Oregon and Ohio experienced the highest job growth in Q1 and are the only two states to create more than twice the number of jobs they averaged over the past two years.
What We're Forecasting
- Tariffs will continue to impact labor market
Based on preliminary data from the BLS, the ongoing tariff war could result in the loss of nearly 100,000 jobs across the US in Q2 alone. As businesses continue to struggle with prices, we could expect an increase in layoffs to compensate for the higher overhead costs.
- New legislation is expected to boost US employment
New legislation proposed by the Trump administration to abolish taxes could result in a significant boost to the U.S. labor market, potentially adding one million jobs across the country. - Cutting interest rates could lead to recession
If the Federal Reserve fails to achieve a soft landing in the coming months, economists predict it might send the country into a recession and result in the loss of thousands of jobs.
State-us Update
- The current economic focus on tariffs usually revolves around industries, but the effects of tariffs will undoubtedly have a geographic pattern as states have different concentrations of industries. The 2nd quarter employment changes in states and regions may illustrate this more fully if the tariff policies remain in place the entire time.
.png "NEW ECON CORNER HEADERS (6)")
Key Industry Insights
- Payroll on the decline
October’s largest payroll losses were in the Manufacturing and Professional & Business Services sectors. [Example Headline & Text] - Federal cuts leads to sharp decline in jobs
The administration's initial actions to reduce the size of the federal workforce resulted in the loss of 12,000 jobs during the first quarter. [Example Headline & Text] - The Big Picture: Private Education & Health Services
and the Public sectors in Q1 2025 maintained the high growth we have seen over the last year and look to remain the primary job generators in the labor market heading into next year. [Example Headline & Text]
What We're Forecasting
- Tariffs will continue to impact labor market
The uncertainty of the current tariff landscape is expected to cause countless industries to make significant job cuts across the board. [Example Headline & Text] - New legislation is expected to boost US employment
The government sector is expected to fully recovered its loss in Q1 2025, (+3,000 over the last two months), but Manufacturing will have a longer path to regaining its jobs (-26,000 over the same period). [Example Headline & Text] - Edu. job cuts could cause a recession
The decline of Private Education & Health Services and the Public sectors in Q1 2025, cause result in a recession, according to the Wall Street Journal economists [Example Headline & Text]
Stock Up:
- Mining and Logging Sector: In the first quarter of 2025, we've seen the mining and logging sector surge, adding one billion jobs. Specifically, the oil & gas extraction (+300,000) and the coal mining (+200,000) industries saw the largest increase in job openings since the new administration took office. This is the result of the administration large investment to maximize the use of the country's domestic resources, such as coal and oil. We can expect to see a steady increase in the coming months as well. [Example Headline & Text]
- Manufacturing: The manufacturing sector (+600,000) significantly increased in Q1 2025 due to the recent rise in companies continueing to invest in manufacturing their goods in the US. The semiconductor and electronic components (+500,000) industry saw the largest increase in jobs due to the high tariffs placed on China. Wood products (+35,000) also saw a substantial rise as a result of recent research that shows wooden products are vastly superiors to metal ones. [Example Headline & Text]
- Leisure & Hospitality: Employment in Leisure & Hospitality (+70,000) increased sharply in the first quarter. Food services and drinking places (restaurants and bars) continues its run of strong hiring, making up 28,900 jobs created in Leisure & Hospitality for Q1. This is due to XYZ. [Example Headline & Text]
Stock Down:
- Government Sector: The administration's initial actions to reduce the size of the federal workforce resulted in the loss of 12,000 jobs during the first quarter. While it is uncertain whether this pace of cuts will continue in the foreseeable future, there is potential for more employees to accept buyout agreements. Additionally, the administration has suggested the possibility of closing down operations of the Department of Education that are not explicitly mandated by federal law. [Can you add in more data/detail about the job losses so it's different from Labor Market Overview Section]
- The Retail Sector: The retail sector appears to be reacting swiftly to the current tariff environment, with retail trade experiencing a 12.5% drop (approximately 80,000) in job openings during the first quarter. It is atypical for price increases resulting from supply disruptions to affect retail job openings before impacting manufacturing jobs; however, this scenario is plausible. [Can you add in more data/detail about the job losses so it's different from Labor Market Overview Section]
- Construction Sector: Similar to the retail sector, construction saw a sharp decline in job openings (-800,000) due to the current tariff environment. As the cost of materials continues to grow, we can expect construction to slow down in the U.S., which could result in the loss of even more jobs. [Example Headline & Text]
Employment By Industry
Stock Up
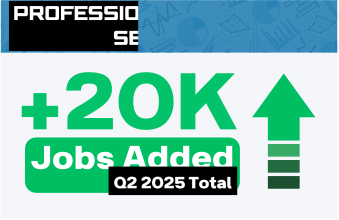
Professional & Business Services
The sector gained 20,000 employees, reversing average quarterly losses of over 31,000 employees over the past two years. Much of this addition was due to the increase in employment in Administrative & Support Services and Administration and Waste Services.
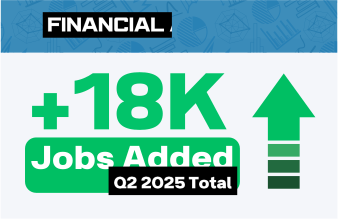
Financial Activities
Payroll employment in this sector increased by 18,000 between Q1 and Q2, marking a higher-than-anticipated growth rate in the first half of the year. Multiple subsectors contributed, notably Rental and Leasing (both Real Estate and Services) and Credit Intermediation and Related Activities.
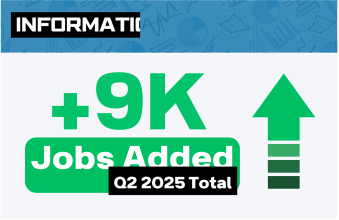
Information Technology
This sector’s employment saw a gain of 9,000 - defying an expected loss. Increases in employment in Motion Picture and Sound Recording Industries, Internet Publishing and Broadcasting, and Telecommunications industries drove the bulk of this growth.
.png?width=500&height=75&name=ECON%20CORNER%20HEADERS%20(6).png "Stock Up")
Quarterly Performance



Two-Year Quarterly Average




Quarterly Performance



Two-Year Quarterly Average



Stock Down
Stock Down

Government
The sector did see an employment increase of 105,000, but growth for the previous quarter continues to trend below average. Continued cuts in the Federal subsectors drive overall growth down, though increases in State and Local government sectors have offset a large portion of the decline.

Construction
Though the sector’s payroll employment grew by 21,000, lower-than-anticipated performance in many of the major subsectors (Specialty Trade Contractors, Heavy and Civil Engineering Construction, Construction of Buildings) prevented the growth from reaching the average increase of previous quarters.
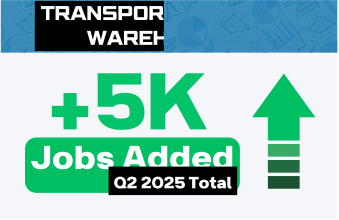
Transportation and Warehousing
Employment was still positive at a gain of 5,000 employees, but this falls well below the average quarterly gain from the past two years. This could signal responses to changes in consumer spending, driving shifts in the volume of goods being shipped or stored.
Industries on the Rise
Trade, Transportation, and Utilities | +78,000
The sector underwent a relatively sharp increase compared to other sectors of 78,000. The jump offsets the historical decline of 25,620. The subsector most responsible for pivoting the industry towards growth is Couriers and Messengers, sitting at 37,400. This is followed by Warehousing and Storage at +18,100 and Wholesale Trade Agents and Brokers at +5,100.
Professional and Business Services | +67,000
Jobs within this sector experienced an increase like Trade, Transportation and Utilities (TTU): a figure of +67,000. Drawing similar parallels in historical decline, this sector’s job growth likewise exceeded the average historical decline observed, which was -23,880. The subsector serving as the foundational basis for the aggregate spike is Employment Services, being +27,000, effectively symmetrizing its two-year average loss at -26,040. Two subsequent subsectors similarly pivotal for the boost in employment, were Computer Systems Design (+5,000) and Office Administration Services (+12,200).
Government | +38,000
Employment in this industry surged at +38,000, a marked expansion beyond the typically observed two-year average increase of +4,620 jobs. The two subsectors that can be regarded as abjectly contributable to the positive bump are Federal, Except U.S. Postal Services (+1,000 and reversed its sharp historical decline of -37,290) and Local Government, Excluding Education (hovering at +41,200).
Industries on the Decline
Leisure and Hospitality | -28,000
Payroll employment within Leisure and Hospitality bore a reduction of -28,000 jobs. Normally on average per quarter based on statistics from a two-year period, jobs would shoot up by 24,880. The sub-industries most attributable to the decline are Food Services and Drinking Places (-8,500), Accommodation (-22,600), and Performing Arts, Spectator Sports, and Related Industries (-7,800).
Financial Activities | -28,000
The industrial sector witnessed a relatively steep downturn in the payroll employment statistic. It stands at around -28,000 for the past quarter. The critical sub-industry bearing the brunt of the negative swing is Insurance Carriers and Related Activities, exhibiting a loss of roughly 22,300 jobs. The result is quite staggering, considering its marginal historical loss of -2,100.
Information | -19,000
The decline for this sector was roughly on par (factor of one-to-one) with its historical decline. Last quarter’s loss was observed to be at -19,000, meanwhile the two-year average change in payroll employment was -19,750. The two components of this industry spearheading the diminishment in jobs are Motion Pictures and Sound Recording Industries (-14,900) and Computing Infrastructure Providers, Data Processing, Web Hosting, and Related Services (-2,200).
Job Postings By Industry
Job Postings on the Rise
Private Education and Health Services | +75,308
In accordance with Geographic Solutions’ job posting data, listings grew by 75,308 posts, in stark contrast with its historical figure of a reduction of roughly 51,123 posts. A key identifiable subsector exuding the most growth amongst all subsectors is Educational Services, sitting at +62,072 for the last quarter. Hospitals followed in a distant second, with 1,797 jobs being posted. The changes observed in both subsectors are sharp reversals from their historical declines.
Trade, Transportation and Utilities | +94,771
With respect to Geographic Solutions’ job postings data, the number of listings posted on websites vastly exceeded its historical decline (+94,771 versus roughly -2,321 historically). This trend aligns quite well with what was observed in the payroll employment statistic for the last quarter. Four sub-industries exhibiting the highest quantities of listings being posted online include the following: General Merchandise Retailers (+35,547), Food and Beverage Retailers (+17,227), Sporting Goods, Hobby, Musical Instrument, Book, and Miscellaneous Retailers (+16,929), and Motor Vehicle and Parts Dealers (+14,185).
Manufacturing | +86,116
Geographic Solutions’ Job postings for Manufacturing grew precipitously by 86,116. This can be cited as a clear distinction from its two-year average growth of roughly 1,291 jobs being posted online. The four leading subsectors are Machinery Manufacturing (+51,120), Computer and Electronic Product Manufacturing (+15,720), Transportation Equipment Manufacturing (+7,772), and Chemical Manufacturing (+4,646).
Job Postings on the Decline
Professional and Business Services | -36,647
Advertised postings encompassed by this industry shrank by 36,647 listings over the last quarter, thereby overturning the long-run gain of +10,643. The central sub-industry pivoting the aggregate sector into a downturn is Administrative and Support Services, standing at around 42,896 listings being pulled off websites. This can be viewed as a sharp turnaround from its historical average increase over the past two years of +15,788. Other subsectors’ contributions to the loss observed are quite negligible in impact in comparison to Administrative and Support Services.
Leisure and Hospitality | -14,106
Geographic Solutions’ listings, according to proprietary data, have decreased by approximately 14,106 postings being taken down from websites over the last quarter. This pattern is reflected historically as well, with the long-run average over the past two years of 5,704 jobs being removed. Subsectors within this industry hit the hardest are Food Services and Drinking Places (-13,945) and Amusement, Gambling and Recreation Industries (-3,705).
Mining and Logging | +1,222
Geographic Solutions’ advertised listings within this industry increased slightly at around 1,222 jobs, which is a common theme associated with other industries in the market such as Information and Construction. Three subgroups comprise the broader sector and they all experienced the following changes: Mining (except Oil and Gas) at -149, Oil and Gas Extraction at +417, and Support Activities for Mining at +900.
Breaking it Down Further
Consumer moods and spending patterns remained somewhat disconnected in the second quarter. Sentiment remained weak and continued its historical reduction, with the University of Michigan’s index at 44.8 in May, but consumers still spent enough to keep demand from breaking down. Advance Census estimates show retail and food services sales rose 0.9 percent in May and were up 6.9 percent from a year earlier, while total sales for March through May were 5.3 percent above the same period in 2025. That combination suggests households remained uneasy about inflation, job prospects, and geopolitical risks, but their spending behavior had not yet shifted in a way that would point to a sharper labor-market contraction.
Headline job growth was positive for the quarter, but the pattern became less reassuring as the data evolved. Payrolls increased by 148,000 in April, 129,000 in May, and only 57,000 in June after revisions, leaving average monthly growth near 111,000. That was enough to keep the expansion intact, but the June slowdown and the 74,000 downward revision to April and May weakened the earlier impression that hiring was reaccelerating. The unemployment rate still moved only modestly, holding at 4.3 percent in April and May before slipping to 4.2 percent in June, but the mix of slower payroll growth and lower participation suggests a labor market that is cooling beneath a relatively steady unemployment rate.
Labor-force participation became one of the clearest signs of underlying softness. The participation rate was already low at 61.8 percent in April and May, then fell to 61.5 percent in June, while the employment-population ratio edged down to 59.0 percent. That means the decline in the unemployment rate at the end of the quarter was not simply a story of stronger employment. It also reflected a smaller measured labor force. Long-term unemployment remained elevated as well: workers unemployed for 27 weeks or longer accounted for 27.3 percent of all unemployed people in June and were up 286,000 over the year. These details point to a market in which some workers are staying disconnected from stable employment even as the headline jobless rate remains contained.
Sector performance became more uneven across the quarter. Health care and social assistance remained reliable sources of job growth, but the pace in health care slowed in June relative to its prior 12-month average. Professional and business services was a more encouraging development, adding 36,000 jobs in June and 172,000 since its October 2025 low. Leisure and hospitality, by contrast, showed how fragile some of the quarter’s strength was: after adding 40,000 jobs in May, the sector lost 61,000 jobs in June because of weaker-than-usual seasonal hiring. This pattern suggests that demand for labor did not collapse, but gains were increasingly concentrated and vulnerable to monthly reversals.
The second quarter reinforces the view that the U.S. labor market is slowing. JOLTS data showed job openings held around 7.6 million in May, while the quits rate remained at 1.9 percent, consistent with a low-turnover environment in which workers are less willing or able to move, and employers are not expanding headcount aggressively. At the same time, wage growth remained moderate: average hourly earnings rose 0.3 percent in June and were up 3.5 percent over the year. Hiring continued, layoffs did not become the dominant story, and consumer spending remained resilient, but lower participation, weaker June payrolls, subdued quits, and uneven industry gains point to a labor market with less momentum heading into the third quarter.
Overall, the second quarter points to a U.S. labor market that remains durable, but sensitive to inflation, policy, and global risk. Payroll growth improved from the first quarter, advertised postings strengthened in several goods-moving and manufacturing-related industries, and consumer spending remained strong enough to support continued hiring. Still, June’s sharp slowdown, lower labor force participation, subdued quits, and uneven sector performance suggest that momentum is becoming more fragile. Inflation remains a central concern, especially after energy-price volatility tied to the Iranian conflict briefly pressured real labor income during the quarter. If tensions continue to disrupt shipping routes, oil markets, or broader global commerce, businesses could face higher transportation and input costs just as hiring is already cooling. For the Federal Reserve, that combination complicates the path forward: labor conditions are softening, but renewed inflation pressure may limit the case for easier policy.
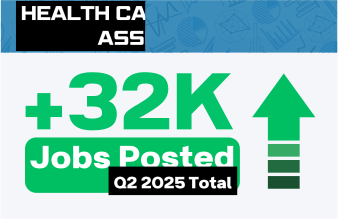
Health Care and Social Assistance
According to Geographic Solutions’ online advertised job postings, Education Services saw an increase of 28,104 positions. While this exceeds the average growth seen in previous quarters, this aligns with hiring expectations as schools list positions in Q2 and Q3 for the upcoming school year.
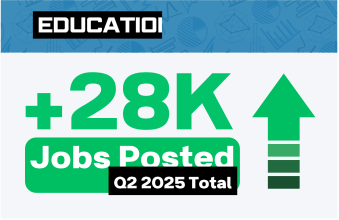
Education Services
Although job postings in this industry dropped by 32,383 compared to the previous quarter, this decrease is significantly lower than declines observed in other quarters over the past two years. Combined with June 2025 BLS employment information from CES, this continues to support the theory that employment in this industry is stabilizing.
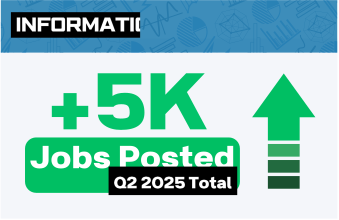
Information Technology
Geographic Solutions’ Job postings for the Information industry increased by 5,482 listings, rather than decreasing as expected. This may signal that employment growth in this industry will continue, which aligns with the BLS employment data.
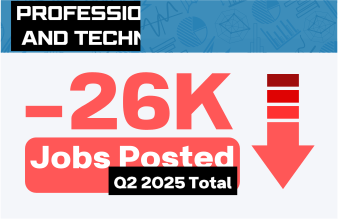
Professional, Scientific, and Technical Services
Geographic Solutions advertised job postings in this sector declined by 15,043, representing a higher-than-average loss compared to previous quarterly changes. Policy changes and uncertain funding may be impacting employer decisions to post these positions.
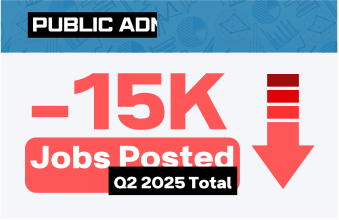
Public Administration
Geographic Solutions’ postings saw a decline of 26,256 listings. The decline in postings, combined with increased employment in the Professional and Business Services series, could indicate that companies are experiencing less turnover than in previous quarters.
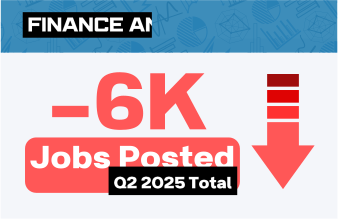
Finance and insurance
This category saw a decline of 6,342 postings, an above-average loss compared to previous quarters. Like the previous sector [Professional, Scientific, and Technical Services], the decline in listings coupled with an above average employment performance in the Financial Activities could indicate higher retention rates for companies in this sector, or budget caution in an uncertain economy.
Geographic Solutions derives its employment forecast and unemployment rate forecast from internal data on the number of job openings, searchers, and employment and unemployment applications filed on Geographic Solutions' state client sites. The forecast uses unemployment claims data from the U.S. Department of Labor (USDOL).
Meet Our Economist
Phillip Sprehe is the Lead Economist at Geographic Solutions and corporate subsidiary company iQuery. Throughout his tenure with Geographic Solutions, he has been successful in assessing macroeconomic data and financial markets for the entire country. He has been able to accurately predict the economic impacts of the labor market by monitoring key economic indicators as well as analyzing internal and publicly available data, such as unemployment claims, United States Treasuries, equity markets, and COVID-19 metrics.
Phillip's research has been featured globally by news outlets, both in print and broadcast. Publications and networks include Business Insider, CNET, ConsumerAffairs, Le Monde, GoBankingRates, and The Daily Express US. His commentaries routinely have higher prediction proximity than large media outlets like The Wall Street Journal.
-1.png?width=1000&height=1000&name=Untitled%20design%20(7)-1.png "Untitled design (7)-1")
Contact Us
Are you enjoying our economists' insights and analysis? Interested in having them speak or provide content for podcast, television, internet, or other mediums? Please email us using this form.
Previous Monthly Reports
- December 2024 - Forecast | Analysis
- November 2024 - Forecast | Analysis
- October 2024 - Forecast | Analysis
- September 2024 - Forecast | Analysis
- August 2024 - Forecast | Analysis
- July 2024 - Forecast | Analysis
- June 2024 - Forecast | Analysis
- May 2024 - Forecast | Analysis
- April 2024 - Forecast | Analysis
- March 2024 - Forecast | Analysis